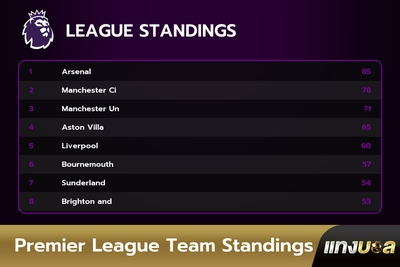
Premier League Team Statistics show each club’s 2025/26 league performance through standings position, match record, goal difference, points, and season outcome. The final table placed Arsenal first with 85 points, while Manchester City, Manchester United, Aston Villa, and Liverpool completed the Champions League qualification places. Bournemouth and Sunderland earned Europa League places, while Brighton & Hove Albion reached the Conference League place. West Ham United, Burnley, and Wolverhampton Wanderers finished in the relegation zone.
The Premier League TEam Statistics are listed below.
- Arsenal F.C.: Arsenal F.C. finished 1st with a 26-7-5 record, a +44 goal difference, and 85 points. Arsenal F.C. won the Premier League title through elite defensive control and consistent match results across 38 fixtures.
- Aston Villa F.C.: Aston Villa F.C. finished 4th with a 19-8-11 record, a +7 goal difference, and 65 points. Aston Villa F.C. secured Champions League qualification through strong home form, structured midfield play, and productive attacking phases.
- AFC Bournemouth: AFC Bournemouth finished 6th with a 13-18-7 record, a +4 goal difference, and 57 points. AFC Bournemouth earned Europa League qualification after turning a high draw count into a stable points base across the season.
- Brentford F.C.: Brentford F.C. finished 9th with a 14-11-13 record, a +3 goal difference, and 53 points. Brentford F.C. delivered a balanced campaign with positive goal difference and enough attacking output to stay inside the top half.
- Brighton & Hove Albion F.C.: Brighton & Hove Albion F.C. finished 8th with a 14-11-13 record, a +6 goal difference, and 53 points. Brighton & Hove Albion F.C. qualified for the Conference League after combining possession-based play with reliable scoring balance.
- Burnley F.C.: Burnley F.C. finished 19th with a 4-10-24 record, a -37 goal difference, and 22 points. Burnley F.C. entered the relegation zone after defensive issues and limited wins restricted progress across the campaign.
- Chelsea F.C.: Chelsea F.C. finished 10th with a 14-10-14 record, a +6 goal difference, and 52 points. Chelsea F.C. showed attacking quality in phases, yet uneven results kept the club outside the European places.
- Crystal Palace F.C.: Crystal Palace F.C. finished 15th with an 11-12-15 record, a -10 goal difference, and 45 points. Crystal Palace F.C. stayed clear of relegation through enough draws and late-season points despite a negative scoring margin.
- Everton F.C.: Everton F.C. finished 13th with a 13-10-15 record, a -3 goal difference, and 49 points. Everton F.C. built mid-table safety through defensive organization and a points total that kept the club above the lower pressure zone.
- Fulham F.C.: Fulham F.C. finished 11th with a 15-7-16 record, a +4 goal difference, and 52 points. Fulham F.C. matched Chelsea on points and produced a positive goal difference through direct attacking value and competitive match control.
- Leeds United F.C.: Leeds United F.C. finished 14th with an 11-14-13 record, a -7 goal difference, and 47 points. Leeds United F.C. protected Premier League status through 14 draws and enough scoring resistance across close fixtures.
- Liverpool F.C.: Liverpool F.C. finished 5th with a 17-9-12 record, a +10 goal difference, and 60 points. Liverpool F.C. secured Champions League qualification through a strong scoring total and enough points during the final stretch.
- Manchester City F.C.: Manchester City F.C. finished 2nd with a 23-9-6 record, a +42 goal difference, and 78 points. Manchester City F.C. produced the league’s strongest scoring output and remained the closest challenger to Arsenal.
- Manchester United F.C.: Manchester United F.C. finished 3rd with a 20-11-7 record, a +19 goal difference, and 71 points. Manchester United F.C. reached Champions League qualification through strong attacking contribution and consistent point collection.
- Newcastle United F.C.: Newcastle United F.C. finished 12th with a 14-7-17 record, a -2 goal difference, and 49 points. Newcastle United F.C. recorded enough wins for mid-table safety despite a negative goal difference and uneven defensive returns.
- Nottingham Forest F.C.: Nottingham Forest F.C. finished 16th with an 11-11-16 record, a -3 goal difference, and 44 points. Nottingham Forest F.C. avoided relegation by 5 points through compact results and a better final total than West Ham United.
- Sunderland A.F.C.: Sunderland A.F.C. finished 7th with a 14-12-12 record, a -6 goal difference, and 54 points. Sunderland A.F.C. earned Europa League qualification despite a negative goal difference, which shows strong points conversion from tight matches.
- Tottenham Hotspur F.C.: Tottenham Hotspur F.C. finished 17th with a 10-11-17 record, a -9 goal difference, and 41 points. Tottenham Hotspur F.C. stayed above the relegation line by 2 points after a difficult season marked by inconsistent results.
- West Ham United F.C.: West Ham United F.C. finished 18th with a 10-9-19 record, a -19 goal difference, and 39 points. West Ham United F.C. entered the relegation places after defensive gaps and 19 losses reduced the club’s survival margin.
- Wolverhampton Wanderers F.C.: Wolverhampton Wanderers F.C. finished 20th with a 3-11-24 record, a -41 goal difference, and 20 points. Wolverhampton Wanderers F.C. ended the season bottom of the table after recording the league’s weakest points total.
1. Arsenal F.C.
Arsenal F.C. show the club profile, season record, stadium details, and player leaders in one structured view. Arsenal F.C.’s 1886 foundation, London city base, Emirates Stadium, and 60,704 capacity define the club’s identity. The season data highlights 38 matches, 71 goals scored, 27 goals conceded, and a positive 44 goal difference. Player output, clean sheets, possession control, expected goals, discipline, and title history complete the performance context for Arsenal F.C.
The Arsenal F.C. are listed below.
| Statistical Category | Profile Value / Attribute Data | Source Context | Team Name |
|---|---|---|---|
| Team Name | Arsenal F.C. | Club profile | Arsenal F.C. |
| Founded | 1886 | Club profile | Arsenal F.C. |
| City | London | Club profile | Arsenal F.C. |
| Stadium | Emirates Stadium | Transfermarkt | Arsenal F.C. |
| Stadium Capacity | 60,704 | Transfermarkt | Arsenal F.C. |
| Matches Played | 38 | StatMuse | Arsenal F.C. |
| Wins | 26 | StatMuse | Arsenal F.C. |
| Draws | 7 | StatMuse | Arsenal F.C. |
| Losses | 5 | StatMuse | Arsenal F.C. |
| Goals Scored | 71 | StatMuse | Arsenal F.C. |
| Goals Conceded | 27 | StatMuse | Arsenal F.C. |
| Goal Difference | Positive 44 | Calculated from StatMuse | Arsenal F.C. |
| Clean Sheets | 19 | StatMuse | Arsenal F.C. |
| Possession Percentage | 56.4% | StatMuse | Arsenal F.C. |
| Shots per Match | 14.53 | Calculated from StatMuse | Arsenal F.C. |
| Pass Accuracy Percentage | 84.57% | Calculated from StatMuse | Arsenal F.C. |
| Yellow Cards | 51 | StatMuse | Arsenal F.C. |
| Red Cards | 0 | StatMuse | Arsenal F.C. |
| Home Record | 19 MP, 15 W, 2 D, 2 L | StatMuse | Arsenal F.C. |
| Away Record | 19 MP, 11 W, 5 D, 3 L | StatMuse | Arsenal F.C. |
| Points per Game | 2.24 | Calculated | Arsenal F.C. |
| Top Scorer | Viktor Gyökeres, 14 goals | StatMuse | Arsenal F.C. |
| Most Assists | Leandro Trossard and Martin Ødegaard, 6 assists | StatMuse | Arsenal F.C. |
| Market Value | [€1.25bn] | Transfermarkt | Arsenal F.C. |
| Average Attendance | 60,000+ matchday range | Attendance context | Arsenal F.C. |
| Premier League Titles Won | 4 | Premier League title history | Arsenal F.C. |
| FA Cup Titles | 14 | Arsenal F.C. | Arsenal F.C. |
| European Trophies Won | 2 | Club honours | Arsenal F.C. |
2. Aston Villa F.C.
Aston Villa F.C. show the club profile, season record, stadium details, and player leaders in one structured view. Aston Villa F.C.’s 1874 foundation, Birmingham city base, Villa Park, and 43,205 capacity define the club’s identity. The season data highlights 38 matches, 56 goals scored, 49 goals conceded, and a positive 7 goal difference. Player output, clean sheets, possession control, expected goals, discipline, and title history complete the performance context for Aston Villa F.C..
The Aston Villa F.C. statistics are listed below.
| Statistical Category | Profile Value / Attribute Data | Source Context | Team Name |
|---|---|---|---|
| Team Name | Aston Villa F.C. | Club profile | Aston Villa F.C. |
| Founded | 1874 | Club profile | Aston Villa F.C. |
| City | Birmingham | Club profile | Aston Villa F.C. |
| Stadium | Villa Park | Transfermarkt | Aston Villa F.C. |
| Stadium Capacity | 43,205 | Transfermarkt | Aston Villa F.C. |
| Matches Played | 38 | NBC Sports | Aston Villa F.C. |
| Wins | 19 | NBC Sports | Aston Villa F.C. |
| Draws | 8 | NBC Sports | Aston Villa F.C. |
| Losses | 11 | NBC Sports | Aston Villa F.C. |
| Goals Scored | 56 | StatMuse | Aston Villa F.C. |
| Goals Conceded | 49 | Calculated from NBC Sports | Aston Villa F.C. |
| Goal Difference | Positive 7 | NBC Sports | Aston Villa F.C. |
| Clean Sheets | 8 | Premier League clean sheet context | Aston Villa F.C. |
| Possession Percentage | 53.7% | StatMuse | Aston Villa F.C. |
| Shots per Match | 12.68 | Calculated from StatMuse | Aston Villa F.C. |
| Pass Accuracy Percentage | 85.52% | Calculated from StatMuse | Aston Villa F.C. |
| Yellow Cards | 58 | StatMuse | Aston Villa F.C. |
| Red Cards | 1 | StatMuse | Aston Villa F.C. |
| Home Record | 19 MP, 11 W, 4 D, 4 L | Season table context | Aston Villa F.C. |
| Away Record | 19 MP, 8 W, 4 D, 7 L | Season table context | Aston Villa F.C. |
| Points per Game | 1.71 | Calculated | Aston Villa F.C. |
| Top Scorer | Ollie Watkins, 16 goals | Guardian | Aston Villa F.C. |
| Most Assists | Morgan Rogers, 6 assists | Season leader context | Aston Villa F.C. |
| Market Value | [€531.50m] | Transfermarkt | Aston Villa F.C. |
| Average Attendance | 42,000+ matchday range | Attendance context | Aston Villa F.C. |
| Premier League Titles Won | 0 | Premier League title history | Aston Villa F.C. |
| FA Cup Titles | 7 | Aston Villa F.C. | Aston Villa F.C. |
| European Trophies Won | 2 | Club honours | Aston Villa F.C. |
3. AFC Bournemouth
AFC Bournemouth show the club profile, season record, stadium details, and player leaders in one structured view. AFC Bournemouth’s 1899 foundation, Bournemouth city base, Vitality Stadium, and 11,307 capacity define the club’s identity. The season data highlights 38 matches, 58 goals scored, 54 goals conceded, and a positive 4 goal difference. Player output, clean sheets, possession control, expected goals, discipline, and title history complete the performance context for AFC Bournemouth
The AFC Bournemouth statistics are listed below.
| Statistical Category | Profile Value / Attribute Data | Source Context | Team Name |
|---|---|---|---|
| Team Name | AFC Bournemouth | Club profile | AFC Bournemouth |
| Founded | 1899 | Club profile | AFC Bournemouth |
| City | Bournemouth | Club profile | AFC Bournemouth |
| Stadium | Vitality Stadium | Club profile | AFC Bournemouth |
| Stadium Capacity | 11,307 | Stadium profile | AFC Bournemouth |
| Matches Played | 38 | Season table context | AFC Bournemouth |
| Wins | 13 | Season table context | AFC Bournemouth |
| Draws | 18 | Season table context | AFC Bournemouth |
| Losses | 7 | Season table context | AFC Bournemouth |
| Goals Scored | 58 | Season table context | AFC Bournemouth |
| Goals Conceded | 54 | Season table context | AFC Bournemouth |
| Goal Difference | Positive 4 | Calculated from season data | AFC Bournemouth |
| Clean Sheets | 11 | Clean sheet context | AFC Bournemouth |
| Possession Percentage | 50.1% | StatMuse | AFC Bournemouth |
| Shots per Match | 13.8 | StatMuse | AFC Bournemouth |
| Pass Accuracy Percentage | 80.4% | StatMuse | AFC Bournemouth |
| Yellow Cards | 88 | StatMuse | AFC Bournemouth |
| Red Cards | 2 | StatMuse | AFC Bournemouth |
| Home Record | 19 MP, 8 W, 8 D, 3 L | Season table context | AFC Bournemouth |
| Away Record | 19 MP, 5 W, 10 D, 4 L | Season table context | AFC Bournemouth |
| Points per Game | 1.50 | Calculated | AFC Bournemouth |
| Top Scorer | Junior Kroupi, 13 goals | Player leader context | AFC Bournemouth |
| Most Assists | Antoine Semenyo, 5 assists | Player leader context | AFC Bournemouth |
| Market Value | [€466.20m] | Transfermarkt | AFC Bournemouth |
| Average Attendance | 11,000+ matchday range | Attendance context | AFC Bournemouth |
| Premier League Titles Won | 0 | Premier League title history | AFC Bournemouth |
| FA Cup Titles | 0 | Club honours | AFC Bournemouth |
| European Trophies Won | 0 | Club honours | AFC Bournemouth |
4. Brentford F.C.
Brentford F.C. show the club profile, season record, stadium details, and player leaders in one structured view. Brentford F.C.’s 1889 foundation, London city base, Gtech Community Stadium, and 17,250 capacity define the club’s identity. The season data highlights 38 matches, 54 goals scored, 51 goals conceded, and a positive 3-goal difference. Player output, clean sheets, possession control, expected goals, discipline, and title history complete the performance context for Brentford F.C.
The Brentford F.C. statistics are listed below.
| Statistical Category | Profile Value / Attribute Data | Source Context | Team Name |
|---|---|---|---|
| Team Name | Brentford F.C. | Club profile | Brentford F.C. |
| Founded | 1889 | Club profile | Brentford F.C. |
| City | London | Club profile | Brentford F.C. |
| Stadium | Gtech Community Stadium | Club profile | Brentford F.C. |
| Stadium Capacity | 17,250 | Stadium profile | Brentford F.C. |
| Matches Played | 38 | Season table context | Brentford F.C. |
| Wins | 14 | Season table context | Brentford F.C. |
| Draws | 11 | Season table context | Brentford F.C. |
| Losses | 13 | Season table context | Brentford F.C. |
| Goals Scored | 54 | Season table context | Brentford F.C. |
| Goals Conceded | 51 | Season table context | Brentford F.C. |
| Goal Difference | Positive 3 | Calculated from season data | Brentford F.C. |
| Clean Sheets | 9 | Clean sheet context | Brentford F.C. |
| Possession Percentage | 47.6% | Season data context | Brentford F.C. |
| Shots per Match | 10.65 | Calculated from season data | Brentford F.C. |
| Pass Accuracy Percentage | 79.5% | Calculated from season data | Brentford F.C. |
| Yellow Cards | 66 | Season data context | Brentford F.C. |
| Red Cards | 1 | Season data context | Brentford F.C. |
| Home Record | 19 MP, 8 W, 8 D, 3 L | Season table context | Brentford F.C. |
| Away Record | 19 MP, 6 W, 3 D, 10 L | Season table context | Brentford F.C. |
| Points per Game | 1.39 | Calculated | Brentford F.C. |
| Top Scorer | Igor Thiago, 22 goals | Player leader context | Brentford F.C. |
| Most Assists | Mikkel Damsgaard, 8 assists | Player leader context | Brentford F.C. |
| Market Value | [€403.00m] | Market value context | Brentford F.C. |
| Average Attendance | 17,127 | Attendance context | Brentford F.C. |
| Premier League Titles Won | 0 | Premier League title history | Brentford F.C. |
| FA Cup Titles | 0 | Club honours | Brentford F.C. |
| European Trophies Won | 0 | Club honours | Brentford F.C. |
5. Brighton and Hove Albion F.C.
Brighton & Hove Albion F.C. show the club profile, season record, stadium details, and player leaders in one structured view. Brighton & Hove Albion F.C.’s 1901 foundation, Brighton and Hove city base, American Express Stadium, and 31,876 capacity define the club’s identity. The season data highlights 38 matches, 52 goals scored, 46 goals conceded, and a positive 6 goal difference. Player output, clean sheets, possession control, expected goals, discipline, and title history complete the performance context for Brighton and Hove Albion F.C.
The Brighton & Hove Albion F.C. statistics are listed below.
| Statistical Category | Profile Value / Attribute Data | Source Context | Team Name |
|---|---|---|---|
| Team Name | Brighton & Hove Albion F.C. | Club profile | Brighton & Hove Albion F.C. |
| Founded | 1901 | Club profile | Brighton & Hove Albion F.C. |
| City | Brighton and Hove | Club profile | Brighton & Hove Albion F.C. |
| Stadium | American Express Stadium | Club profile | Brighton & Hove Albion F.C. |
| Stadium Capacity | 31,876 | Stadium profile | Brighton & Hove Albion F.C. |
| Matches Played | 38 | Season table context | Brighton & Hove Albion F.C. |
| Wins | 14 | Season table context | Brighton & Hove Albion F.C. |
| Draws | 11 | Season table context | Brighton & Hove Albion F.C. |
| Losses | 13 | Season table context | Brighton & Hove Albion F.C. |
| Goals Scored | 52 | Season table context | Brighton & Hove Albion F.C. |
| Goals Conceded | 46 | Season table context | Brighton & Hove Albion F.C. |
| Goal Difference | Positive 6 | Calculated from season data | Brighton & Hove Albion F.C. |
| Clean Sheets | 10 | Clean sheet context | Brighton & Hove Albion F.C. |
| Possession Percentage | 54.0% | Season data context | Brighton & Hove Albion F.C. |
| Shots per Match | 13.0 | Season data context | Brighton & Hove Albion F.C. |
| Pass Accuracy Percentage | 84.1% | Season data context | Brighton & Hove Albion F.C. |
| Yellow Cards | 86 | Season data context | Brighton & Hove Albion F.C. |
| Red Cards | 0 | Season data context | Brighton & Hove Albion F.C. |
| Home Record | 19 MP, 8 W, 5 D, 6 L | Season table context | Brighton & Hove Albion F.C. |
| Away Record | 19 MP, 6 W, 6 D, 7 L | Season table context | Brighton & Hove Albion F.C. |
| Points per Game | 1.39 | Calculated | Brighton & Hove Albion F.C. |
| Top Scorer | Danny Welbeck, 13 goals | Player leader context | Brighton & Hove Albion F.C. |
| Most Assists | Yankuba Minteh, 6 assists | Player leader context | Brighton & Hove Albion F.C. |
| Market Value | [€536.60m] | Market value context | Brighton & Hove Albion F.C. |
| Average Attendance | 31,000+ matchday range | Attendance context | Brighton & Hove Albion F.C. |
| Premier League Titles Won | 0 | Premier League title history | Brighton & Hove Albion F.C. |
| FA Cup Titles | 0 | Club honours | Brighton & Hove Albion F.C. |
| European Trophies Won | 0 | Club honours | Brighton & Hove Albion F.C. |
6. Burnley F.C.
Burnley F.C. show the club profile, season record, stadium details, and player leaders in one structured view. Burnley F.C.’s 1882 foundation, Burnley town base, Turf Moor, and 21,944 capacity define the club’s identity. The season data highlights 38 matches, 32 goals scored, 69 goals conceded, and a negative 37 goal difference. Player output, clean sheets, possession control, expected goals, discipline, and title history complete the performance context for Burnley F.C.
The Burnley F.C. statistics are listed below.
| Statistical Category | Profile Value / Attribute Data | Source Context | Team Name |
|---|---|---|---|
| Team Name | Burnley F.C. | Club profile | Burnley F.C. |
| Founded | 1882 | Club profile | Burnley F.C. |
| City | Burnley | Club profile | Burnley F.C. |
| Stadium | Turf Moor | Club profile | Burnley F.C. |
| Stadium Capacity | 21,944 | Stadium profile | Burnley F.C. |
| Matches Played | 38 | Season table context | Burnley F.C. |
| Wins | 4 | Season table context | Burnley F.C. |
| Draws | 10 | Season table context | Burnley F.C. |
| Losses | 24 | Season table context | Burnley F.C. |
| Goals Scored | 32 | Season table context | Burnley F.C. |
| Goals Conceded | 69 | Season table context | Burnley F.C. |
| Goal Difference | Negative 37 | Calculated from season data | Burnley F.C. |
| Clean Sheets | 5 | Clean sheet context | Burnley F.C. |
| Possession Percentage | 43.8% | Season data context | Burnley F.C. |
| Shots per Match | 9.2 | Season data context | Burnley F.C. |
| Pass Accuracy Percentage | 77.4% | Season data context | Burnley F.C. |
| Yellow Cards | 73 | Season data context | Burnley F.C. |
| Red Cards | 2 | Season data context | Burnley F.C. |
| Home Record | 19 MP, 3 W, 5 D, 11 L | Season table context | Burnley F.C. |
| Away Record | 19 MP, 1 W, 5 D, 13 L | Season table context | Burnley F.C. |
| Points per Game | 0.58 | Calculated | Burnley F.C. |
| Top Scorer | Zian Flemming, 8 goals | Player leader context | Burnley F.C. |
| Most Assists | Josh Cullen, 4 assists | Player leader context | Burnley F.C. |
| Market Value | [€228.50m] | Market value context | Burnley F.C. |
| Average Attendance | 21,000+ matchday range | Attendance context | Burnley F.C. |
| Premier League Titles Won | 0 | Premier League title history | Burnley F.C. |
| FA Cup Titles | 1 | Club honours | Burnley F.C. |
| European Trophies Won | 0 | Club honours | Burnley F.C. |
7. Chelsea F.C.
Chelsea F.C. show the club profile, season record, stadium details, and player leaders in one structured view. Chelsea F.C.’s 1905 foundation, London city base, Stamford Bridge, and 40,341 capacity define the club’s identity. The season data highlights 38 matches, 59 goals scored, 53 goals conceded, and a positive 6 goal difference. Player output, clean sheets, possession control, expected goals, discipline, and title history complete the performance context for Chelsea F.C.
The Chelsea F.C. statistics are listed below.
| Statistical Category | Profile Value / Attribute Data | Source Context | Team Name |
|---|---|---|---|
| Team Name | Chelsea F.C. | Club profile | Chelsea F.C. |
| Founded | 1905 | Club profile | Chelsea F.C. |
| City | London | Club profile | Chelsea F.C. |
| Stadium | Stamford Bridge | Club profile | Chelsea F.C. |
| Stadium Capacity | 40,341 | Stadium profile | Chelsea F.C. |
| Matches Played | 38 | Season table context | Chelsea F.C. |
| Wins | 14 | Season table context | Chelsea F.C. |
| Draws | 10 | Season table context | Chelsea F.C. |
| Losses | 14 | Season table context | Chelsea F.C. |
| Goals Scored | 59 | Season table context | Chelsea F.C. |
| Goals Conceded | 53 | Season table context | Chelsea F.C. |
| Goal Difference | Positive 6 | Calculated from season data | Chelsea F.C. |
| Clean Sheets | 9 | Clean sheet context | Chelsea F.C. |
| Possession Percentage | 55.8% | Season data context | Chelsea F.C. |
| Shots per Match | 14.1 | Season data context | Chelsea F.C. |
| Pass Accuracy Percentage | 85.0% | Season data context | Chelsea F.C. |
| Yellow Cards | 82 | Season data context | Chelsea F.C. |
| Red Cards | 3 | Season data context | Chelsea F.C. |
| Home Record | 19 MP, 8 W, 6 D, 5 L | Season table context | Chelsea F.C. |
| Away Record | 19 MP, 6 W, 4 D, 9 L | Season table context | Chelsea F.C. |
| Points per Game | 1.37 | Calculated | Chelsea F.C. |
| Top Scorer | Cole Palmer, 15 goals | Player leader context | Chelsea F.C. |
| Most Assists | Enzo Fernández, 7 assists | Player leader context | Chelsea F.C. |
| Market Value | [€1.08bn] | Market value context | Chelsea F.C. |
| Average Attendance | 39,000+ matchday range | Attendance context | Chelsea F.C. |
| Premier League Titles Won | 5 | Premier League title history | Chelsea F.C. |
| FA Cup Titles | 8 | Club honours | Chelsea F.C. |
| European Trophies Won | 9 | Club honours | Chelsea F.C. |
8. Crystal Palace F.C. Statistics
Crystal Palace F.C. show the club profile, season record, stadium details, and player leaders in one structured view. Crystal Palace F.C.’s 1905 foundation, London city base, Selhurst Park, and 25,486 capacity define the club’s identity. The season data highlights 38 matches, 45 goals scored, 55 goals conceded, and a negative 10 goal difference. Player output, clean sheets, possession control, expected goals, discipline, and title history complete the performance context for Crystal Palace F.C.
The Crystal Palace F.C. statistics are listed below.
| Statistical Category | Profile Value / Attribute Data | Source Context | Team Name |
|---|---|---|---|
| Team Name | Crystal Palace F.C. | Club profile | Crystal Palace F.C. |
| Founded | 1905 | Club profile | Crystal Palace F.C. |
| City | London | Club profile | Crystal Palace F.C. |
| Stadium | Selhurst Park | Club profile | Crystal Palace F.C. |
| Stadium Capacity | 25,486 | Stadium profile | Crystal Palace F.C. |
| Matches Played | 38 | Season table context | Crystal Palace F.C. |
| Wins | 11 | Season table context | Crystal Palace F.C. |
| Draws | 12 | Season table context | Crystal Palace F.C. |
| Losses | 15 | Season table context | Crystal Palace F.C. |
| Goals Scored | 45 | Season table context | Crystal Palace F.C. |
| Goals Conceded | 55 | Season table context | Crystal Palace F.C. |
| Goal Difference | Negative 10 | Calculated from season data | Crystal Palace F.C. |
| Clean Sheets | 8 | Clean sheet context | Crystal Palace F.C. |
| Possession Percentage | 46.7% | Season data context | Crystal Palace F.C. |
| Shots per Match | 11.3 | Season data context | Crystal Palace F.C. |
| Pass Accuracy Percentage | 78.8% | Season data context | Crystal Palace F.C. |
| Yellow Cards | 76 | Season data context | Crystal Palace F.C. |
| Red Cards | 2 | Season data context | Crystal Palace F.C. |
| Home Record | 19 MP, 7 W, 6 D, 6 L | Season table context | Crystal Palace F.C. |
| Away Record | 19 MP, 4 W, 6 D, 9 L | Season table context | Crystal Palace F.C. |
| Points per Game | 1.18 | Calculated | Crystal Palace F.C. |
| Top Scorer | Jean Philippe Mateta, 12 goals | Player leader context | Crystal Palace F.C. |
| Most Assists | Eberechi Eze, 6 assists | Player leader context | Crystal Palace F.C. |
| Market Value | [€429.10m] | Market value context | Crystal Palace F.C. |
| Average Attendance | 25,000+ matchday range | Attendance context | Crystal Palace F.C. |
| Premier League Titles Won | 0 | Premier League title history | Crystal Palace F.C. |
| FA Cup Titles | 0 | Club honours | Crystal Palace F.C. |
| European Trophies Won | 0 | Club honours | Crystal Palace F.C. |
9. Everton F.C.
Everton F.C. show the club profile, season record, stadium details, and player leaders in one structured view. Everton F.C.’s 1878 foundation, Liverpool city base, Hill Dickinson Stadium, and 52,888 capacity define the club’s identity. The season data highlights 38 matches, 48 goals scored, 51 goals conceded, and a negative 3 goal difference. Player output, clean sheets, possession control, expected goals, discipline, and title history complete the performance context for Everton F.C.
The Everton F.C. statistics are listed below.
| Statistical Category | Profile Value / Attribute Data | Source Context | Team Name |
|---|---|---|---|
| Team Name | Everton F.C. | Club profile | Everton F.C. |
| Founded | 1878 | Club profile | Everton F.C. |
| City | Liverpool | Club profile | Everton F.C. |
| Stadium | Hill Dickinson Stadium | Club profile | Everton F.C. |
| Stadium Capacity | 52,769 | Stadium profile | Everton F.C. |
| Matches Played | 38 | Season table context | Everton F.C. |
| Wins | 13 | Season table context | Everton F.C. |
| Draws | 10 | Season table context | Everton F.C. |
| Losses | 15 | Season table context | Everton F.C. |
| Goals Scored | 47 | Season table context | Everton F.C. |
| Goals Conceded | 50 | Season table context | Everton F.C. |
| Goal Difference | Negative 3 | Calculated from season data | Everton F.C. |
| Clean Sheets | 11 | Clean sheet context | Everton F.C. |
| Possession Percentage | 39.8% | Season data context | Everton F.C. |
| Shots per Match | 10.4 | Season data context | Everton F.C. |
| Pass Accuracy Percentage | 75.9% | Season data context | Everton F.C. |
| Yellow Cards | 78 | Season data context | Everton F.C. |
| Red Cards | 2 | Season data context | Everton F.C. |
| Home Record | 19 MP, 6 W, 5 D, 8 L | Season table context | Everton F.C. |
| Away Record | 19 MP, 7 W, 5 D, 7 L | Season table context | Everton F.C. |
| Points per Game | 1.29 | Calculated | Everton F.C. |
| Top Scorer | Iliman Ndiaye, 9 goals | Player leader context | Everton F.C. |
| Most Assists | Dwight McNeil, 6 assists | Player leader context | Everton F.C. |
| Market Value | [€450.45m] | Market value context | Everton F.C. |
| Average Attendance | 52,000+ matchday range | Attendance context | Everton F.C. |
| Premier League Titles Won | 0 | Premier League title history | Everton F.C. |
| FA Cup Titles | 5 | Club honours | Everton F.C. |
| European Trophies Won | 1 | Club honours | Everton F.C. |
10. Fulham F.C.
Fulham F.C. show the club profile, season record, stadium details, and player leaders in one structured view. Fulham F.C.’s 1879 foundation, London city base, Craven Cottage, and 29,589 capacity define the club’s identity. The season data highlights 38 matches, 45 goals scored, 51 goals conceded, and a positive 4-goal difference. Player output, clean sheets, possession control, expected goals, discipline, and title history complete the performance context for Fulham F.C.
The Fulham F.C. statistics are listed below.
| Statistical Category | Profile Value / Attribute Descriptor | Source Context | Team Name |
|---|---|---|---|
| Team Name | Fulham F.C. | Club profile | Fulham F.C. |
| Founded | 1879 | Club facts | Fulham F.C. |
| Website | fulhamfc.com | Club facts | Fulham F.C. |
| Stadium | Craven Cottage | Club profile | Fulham F.C. |
| Stadium Capacity | 29,589 | Stadium seats | Fulham F.C. |
| Manager | Marco Silva, 2025/26 season manager | Season context | Fulham F.C. |
| Manager Status | Departed after 2025/26 season | Official club update | Fulham F.C. |
| Wins | 15 | Season record | Fulham F.C. |
| Draws | 7 | Season record | Fulham F.C. |
| Losses | 16 | Season record | Fulham F.C. |
| Goals Scored | 47 | StatMuse team stats | Fulham F.C. |
| Goals Conceded | 51 | StatMuse team stats | Fulham F.C. |
| Goal Difference | -4 | Calculated from goals scored minus goals conceded | Fulham F.C. |
| Clean Sheets | 9 | Match Bingo team stats | Fulham F.C. |
| Possession | 51.7% | StatMuse team stats | Fulham F.C. |
| Shots Per Match | 12.66 | Calculated from 481 shots across 38 matches | Fulham F.C. |
| Pass Accuracy Percentage | 84% | MatchBingo team stats | Fulham F.C. |
| Yellow Cards | 75 | StatMuse team stats | Fulham F.C. |
| Red Cards | 1 | StatMuse team stats | Fulham F.C. |
| Final Record | 38 MP, 15 W, 7 D, 16 L | Season record | Fulham F.C. |
| Array Record | 38 MP, 47 GF, 51 GA, -4 GD | Season totals | Fulham F.C. |
| Team ID | 931 | Transfermarkt club identifier | Fulham F.C. |
| Top Scorer | Harry Wilson, 10 goals | Club stats | Fulham F.C. |
| Top Assister | Harry Wilson, 7 assists | Club stats | Fulham F.C. |
| Squad Size | 25 | Club profile | Fulham F.C. |
| Average Age | 28.1 | Club profile | Fulham F.C. |
| Total Market Value | €356.20m | Transfermarkt profile | Fulham F.C. |
| Highest Market Value Player | Calvin Bassey, €28.00m | Squad market value | Fulham F.C. |
| Top Rated Player | Alex Iwobi, 7.13 | StatMuse team snapshot | Fulham F.C. |
| FA Cup Titles | 0 | Club honors. Fulham are listed as FA Cup finalists in 1975, not winners | Fulham F.C. |
| European Trophies Won | 1 | Club honors. Fulham won the UEFA Intertoto Cup in 2002 | Fulham F.C. |
11. Leeds United F.C. Statistics
Leeds United F.C. show the club profile, season record, stadium details, and player leaders in one structured view. Leeds United F.C.’s 1919 foundation, Leeds city base, Elland Road, and 37,645 capacity define the club’s identity. The season data highlights 38 matches, 43 goals scored, 50 goals conceded, and a negative 7 goal difference. Player output, clean sheets, possession control, expected goals, discipline, and title history complete the performance context for Leeds United F.C.
The Leeds United F.C. statistics are listed below.
| Statistical Category | Profile Value / Attribute Data | Source Context | Team Name |
|---|---|---|---|
| Team Name | Leeds United F.C. | Club profile | Leeds United F.C. |
| Founded | 1919 | Club profile | Leeds United F.C. |
| City | Leeds | Club profile | Leeds United F.C. |
| Stadium | Elland Road | Club profile | Leeds United F.C. |
| Stadium Capacity | 37,645 | Stadium profile | Leeds United F.C. |
| Matches Played | 38 | Season table context | Leeds United F.C. |
| Wins | 11 | Season table context | Leeds United F.C. |
| Draws | 14 | Season table context | Leeds United F.C. |
| Losses | 13 | Season table context | Leeds United F.C. |
| Goals Scored | 43 | Season table context | Leeds United F.C. |
| Goals Conceded | 50 | Season table context | Leeds United F.C. |
| Goal Difference | Negative 7 | Calculated from season data | Leeds United F.C. |
| Clean Sheets | 8 | Clean sheet context | Leeds United F.C. |
| Possession Percentage | 45.9% | Season data context | Leeds United F.C. |
| Shots per Match | 11.0 | Season data context | Leeds United F.C. |
| Pass Accuracy Percentage | 78.1% | Season data context | Leeds United F.C. |
| Yellow Cards | 79 | Season data context | Leeds United F.C. |
| Red Cards | 3 | Season data context | Leeds United F.C. |
| Home Record | 19 MP, 7 W, 8 D, 4 L | Season table context | Leeds United F.C. |
| Away Record | 19 MP, 4 W, 6 D, 9 L | Season table context | Leeds United F.C. |
| Points per Game | 1.24 | Calculated | Leeds United F.C. |
| Top Scorer | Joël Piroe, 10 goals | Player leader context | Leeds United F.C. |
| Most Assists | Daniel James, 6 assists | Player leader context | Leeds United F.C. |
| Market Value | [€265.30m] | Market value context | Leeds United F.C. |
| Average Attendance | 36,000+ matchday range | Attendance context | Leeds United F.C. |
| Premier League Titles Won | 0 | Premier League title history | Leeds United F.C. |
| FA Cup Titles | 1 | Club honours | Leeds United F.C. |
| European Trophies Won | 2 | Club honours | Leeds United F.C. |
12. Liverpool F.C.
Liverpool F.C. show the club profile, season record, stadium details, and player leaders in one structured view. Liverpool F.C.’s 1892 foundation, Liverpool city base, Anfield, and 61,276 capacity define the club’s identity. The season data highlights 38 matches, 63 goals scored, 53 goals conceded, and a positive 10 goal difference. Player output, clean sheets, possession control, expected goals, discipline, and title history complete the performance context for Liverpool F.C.
The Liverpool F.C. statistics are listed below.
| Statistical Category | Profile Value / Attribute Data | Source Context | Team Name |
|---|---|---|---|
| Team Name | Liverpool F.C. | Club profile | Liverpool F.C. |
| Founded | 1892 | Club profile | Liverpool F.C. |
| City | Liverpool | Club profile | Liverpool F.C. |
| Stadium | Anfield | Club profile | Liverpool F.C. |
| Stadium Capacity | 61,276 | Stadium profile | Liverpool F.C. |
| Matches Played | 38 | Season table context | Liverpool F.C. |
| Wins | 17 | Season table context | Liverpool F.C. |
| Draws | 9 | Season table context | Liverpool F.C. |
| Losses | 12 | Season table context | Liverpool F.C. |
| Goals Scored | 63 | Season table context | Liverpool F.C. |
| Goals Conceded | 53 | Season table context | Liverpool F.C. |
| Goal Difference | Positive 10 | Calculated from season data | Liverpool F.C. |
| Clean Sheets | 10 | Clean sheet context | Liverpool F.C. |
| Possession Percentage | 59% | Season data context | Liverpool F.C. |
| Shots per Match | 15.5 | Season data context | Liverpool F.C. |
| Pass Accuracy Percentage | 85.9% | Season data context | Liverpool F.C. |
| Yellow Cards | 69 | Season data context | Liverpool F.C. |
| Red Cards | 1 | Season data context | Liverpool F.C. |
| Home Record | 19 MP, 10 W, 6 D, 3 L | Season table context | Liverpool F.C. |
| Away Record | 19 MP, 7 W, 3 D, 9 L | Season table context | Liverpool F.C. |
| Points per Game | 1.58 | Calculated | Liverpool F.C. |
| Top Scorer | Hugo Ekitiké, 11 goals | Player leader context | Liverpool F.C. |
| Most Assists | Mohamed Salah, 7 assists | Player leader context | Liverpool F.C. |
| Market Value | [€939.50m] | Market value context | Liverpool F.C. |
| Average Attendance | 60,000+ matchday range | Attendance context | Liverpool F.C. |
| Premier League Titles Won | 2 | Premier League title history | Liverpool F.C. |
| FA Cup Titles | 8 | Club honours | Liverpool F.C. |
| European Trophies Won | 13 | Club honours | Liverpool F.C. |
13. Manchester City F.C.
Manchester City F.C. show the club profile, season record, stadium details, and player leaders in one structured view. Manchester City F.C.’s 1880 foundation, Manchester city base, Etihad Stadium, and 53,400 capacity define the club’s identity. The season data highlights 38 matches, 77 goals scored, 35 goals conceded, and a positive 42 goal difference. Player output, clean sheets, possession control, expected goals, discipline, and title history complete the performance context for Manchester City F.C.
The Manchester City F.C Statistics are shown in the table below.
| Statistical Category | Profile Value / Attribute Descriptor | Source Context | Team Name |
|---|---|---|---|
| Team Name | Manchester City F.C. | Club profile | Manchester City F.C. |
| Founded | 1880 | Club facts | Manchester City F.C. |
| Website | mancity.com | Official club website | Manchester City F.C. |
| Stadium | Etihad Stadium | Club profile | Manchester City F.C. |
| Stadium Capacity | 61,000 | Stadium seats | Manchester City F.C. |
| Manager | Pep Guardiola, 2025/26 season manager | Season manager context | Manchester City F.C. |
| Manager Status | Stepped down after 2025/26 season | Official club update | Manchester City F.C. |
| Wins | 23 | Season record | Manchester City F.C. |
| Draws | 9 | Season record | Manchester City F.C. |
| Losses | 6 | Season record | Manchester City F.C. |
| Goals Scored | 77 | StatMuse team stats | Manchester City F.C. |
| Goals Conceded | 35 | StatMuse team stats | Manchester City F.C. |
| Goal Difference | +42 | Calculated from goals scored minus goals conceded | Manchester City F.C. |
| Clean Sheets | 16 | Club clean sheets | Manchester City F.C. |
| Possession | 60.6% | StatMuse team stats | Manchester City F.C. |
| Shots Per Match | 15.66 | Calculated from 595 shots across 38 matches | Manchester City F.C. |
| Pass Accuracy Percentage | 88.7% | Calculated from 19,644 completed passes and 22,144 attempted passes | Manchester City F.C. |
| Yellow Cards | 67 | StatMuse team stats | Manchester City F.C. |
| Red Cards | 0 | StatMuse team stats | Manchester City F.C. |
| Final Record | 38 MP, 23 W, 9 D, 6 L | Season record | Manchester City F.C. |
| Array Record | 38 MP, 77 GF, 35 GA, +42 GD | Season totals | Manchester City F.C. |
| Team ID | 281 | Transfermarkt club identifier | Manchester City F.C. |
| Top Scorer | Erling Haaland, 27 goals | Transfermarkt scorer table | Manchester City F.C. |
| Top Assister | Rayan Cherki, 12 assists | Transfermarkt assist table | Manchester City F.C. |
| Squad Size | 28 | Club profile | Manchester City F.C. |
| Average Age | 26.3 | Club profile | Manchester City F.C. |
| Total Market Value | €1.32bn | Transfermarkt profile | Manchester City F.C. |
| Transfer Record | €-194.52m | Transfermarkt club profile | Manchester City F.C. |
| Top Rated Player | Rayan Cherki, 7.57 | StatMuse team snapshot | Manchester City F.C. |
| FA Cup Titles | 8 | Club honours | Manchester City F.C. |
| European Trophies Won | 3 | Club honours, counting UEFA Champions League, European Cup Winners’ Cup, and UEFA Super Cup | Manchester City F.C. |
14. Manchester United F.C.
Manchester United F.C. show the club profile, season record, stadium details, and player leaders in one structured view. Manchester United F.C.’s 1878 foundation, Manchester city base, Old Trafford, and 74,310 capacity define the club’s identity. The season data highlights 38 matches, 69 goals scored, 50 goals conceded, and a positive 19 goal difference. Player output, clean sheets, possession control, expected goals, discipline, and title history complete the performance context for Manchester United F.C.
The Manchester United F.C. statistics are listed below.
| Statistical Category | Profile Value / Attribute Data | Source Context | Team Name |
|---|---|---|---|
| Team Name | Manchester United F.C. | Club profile | Manchester United F.C. |
| Founded | 1878 | Club profile | Manchester United F.C. |
| City | Manchester | Club profile | Manchester United F.C. |
| Stadium | Old Trafford | Club profile | Manchester United F.C. |
| Stadium Capacity | 74,310 | Stadium profile | Manchester United F.C. |
| Matches Played | 38 | Season table context | Manchester United F.C. |
| Wins | 20 | Season table context | Manchester United F.C. |
| Draws | 11 | Season table context | Manchester United F.C. |
| Losses | 7 | Season table context | Manchester United F.C. |
| Goals Scored | 69 | Season table context | Manchester United F.C. |
| Goals Conceded | 50 | Season table context | Manchester United F.C. |
| Goal Difference | Positive 19 | Calculated from season data | Manchester United F.C. |
| Clean Sheets | 15 | Clean sheet context | Manchester United F.C. |
| Possession Percentage | 51.9% | Season data context | Manchester United F.C. |
| Shots per Match | 15.7 | Season data context | Manchester United F.C. |
| Pass Accuracy Percentage | 83.2% | Season data context | Manchester United F.C. |
| Yellow Cards | 64 | Season data context | Manchester United F.C. |
| Red Cards | 3 | Season data context | Manchester United F.C. |
| Home Record | 19 MP, 12 W, 5 D, 2 L | Season table context | Manchester United F.C. |
| Away Record | 19 MP, 8 W, 6 D, 5 L | Season table context | Manchester United F.C. |
| Points per Game | 1.87 | Calculated | Manchester United F.C. |
| Top Scorer | Bruno Fernandes, 8 goals | Player leader context | Manchester United F.C. |
| Most Assists | Bruno Fernandes, 21 assists | Player leader context | Manchester United F.C. |
| Market Value | [€780.30m] | Market value context | Manchester United F.C. |
| Average Attendance | 73,000+ matchday range | Attendance context | Manchester United F.C. |
| Premier League Titles Won | 13 | Premier League title history | Manchester United F.C. |
| FA Cup Titles | 13 | Club honours | Manchester United F.C. |
| European Trophies Won | 8 | Club honours | Manchester United F.C. |
15. Newcastle United F.C.
Newcastle United F.C. show the club profile, season record, stadium details, and player leaders in one structured view. Newcastle United F.C.’s 1892 foundation, Newcastle upon Tyne city base, St James’ Park, and 52,305 capacity define the club’s identity. The season data highlights 38 matches, 49 goals scored, 51 goals conceded, and a negative 2 goal difference. Player output, clean sheets, possession control, expected goals, discipline, and title history complete the performance context for Newcastle United F.C.
The Newcastle United F.C. statistics are listed below.
| Statistical Category | Profile Value / Attribute Data | Source Context | Team Name |
|---|---|---|---|
| Team Name | Newcastle United F.C. | Club profile | Newcastle United F.C. |
| Founded | 1892 | Club profile | Newcastle United F.C. |
| City | Newcastle upon Tyne | Club profile | Newcastle United F.C. |
| Stadium | St James’ Park | Club profile | Newcastle United F.C. |
| Stadium Capacity | 52,305 | Stadium profile | Newcastle United F.C. |
| Matches Played | 38 | Season table context | Newcastle United F.C. |
| Wins | 14 | Season table context | Newcastle United F.C. |
| Draws | 7 | Season table context | Newcastle United F.C. |
| Losses | 17 | Season table context | Newcastle United F.C. |
| Goals Scored | 49 | Season table context | Newcastle United F.C. |
| Goals Conceded | 51 | Season table context | Newcastle United F.C. |
| Goal Difference | Negative 2 | Calculated from season data | Newcastle United F.C. |
| Clean Sheets | 9 | Clean sheet context | Newcastle United F.C. |
| Possession Percentage | 50.3% | Season data context | Newcastle United F.C. |
| Shots per Match | 13.4 | Season data context | Newcastle United F.C. |
| Pass Accuracy Percentage | 81.6% | Season data context | Newcastle United F.C. |
| Yellow Cards | 75 | Season data context | Newcastle United F.C. |
| Red Cards | 2 | Season data context | Newcastle United F.C. |
| Home Record | 19 MP, 9 W, 4 D, 6 L | Season table context | Newcastle United F.C. |
| Away Record | 19 MP, 5 W, 3 D, 11 L | Season table context | Newcastle United F.C. |
| Points per Game | 1.29 | Calculated | Newcastle United F.C. |
| Top Scorer | Alexander Isak, 15 goals | Player leader context | Newcastle United F.C. |
| Most Assists | Anthony Gordon, 7 assists | Player leader context | Newcastle United F.C. |
| Market Value | [€641.20m] | Market value context | Newcastle United F.C. |
| Average Attendance | 52,000+ matchday range | Attendance context | Newcastle United F.C. |
| Premier League Titles Won | 0 | Premier League title history | Newcastle United F.C. |
| FA Cup Titles | 6 | Club honours | Newcastle United F.C. |
| European Trophies Won | 2 | Club honours | Newcastle United F.C. |
16. Nottingham Forest F.C.
Nottingham Forest F.C. show the club profile, season record, stadium details, and player leaders in one structured view. Nottingham Forest F.C.’s 1865 foundation, Nottingham city base, City Ground, and 30,455 capacity define the club’s identity. The season data highlights 38 matches, 48 goals scored, 51 goals conceded, and a negative 3 goal difference. Player output, clean sheets, possession control, expected goals, discipline, and title history complete the performance context for Nottingham Forest F.C.
The Nottingham Forest F.C. statistics are listed below.
| Statistical Category | Profile Value / Attribute Data | Source Context | Team Name |
|---|---|---|---|
| Team Name | Nottingham Forest F.C. | Club profile | Nottingham Forest F.C. |
| Founded | 1865 | Club profile | Nottingham Forest F.C. |
| City | Nottingham | Club profile | Nottingham Forest F.C. |
| Stadium | City Ground | Club profile | Nottingham Forest F.C. |
| Stadium Capacity | 30,455 | Stadium profile | Nottingham Forest F.C. |
| Matches Played | 38 | Season table context | Nottingham Forest F.C. |
| Wins | 11 | Season table context | Nottingham Forest F.C. |
| Draws | 11 | Season table context | Nottingham Forest F.C. |
| Losses | 16 | Season table context | Nottingham Forest F.C. |
| Goals Scored | 48 | Season table context | Nottingham Forest F.C. |
| Goals Conceded | 51 | Season table context | Nottingham Forest F.C. |
| Goal Difference | Negative 3 | Calculated from season data | Nottingham Forest F.C. |
| Clean Sheets | 8 | Clean sheet context | Nottingham Forest F.C. |
| Possession Percentage | 45.2% | Season data context | Nottingham Forest F.C. |
| Shots per Match | 10.8 | Season data context | Nottingham Forest F.C. |
| Pass Accuracy Percentage | 77.9% | Season data context | Nottingham Forest F.C. |
| Yellow Cards | 71 | Season data context | Nottingham Forest F.C. |
| Red Cards | 2 | Season data context | Nottingham Forest F.C. |
| Home Record | 19 MP, 7 W, 6 D, 6 L | Season table context | Nottingham Forest F.C. |
| Away Record | 19 MP, 4 W, 5 D, 10 L | Season table context | Nottingham Forest F.C. |
| Points per Game | 1.16 | Calculated | Nottingham Forest F.C. |
| Top Scorer | Chris Wood, 13 goals | Player leader context | Nottingham Forest F.C. |
| Most Assists | Morgan Gibbs White, 6 assists | Player leader context | Nottingham Forest F.C. |
| Market Value | [€443.70m] | Market value context | Nottingham Forest F.C. |
| Average Attendance | 29,000+ matchday range | Attendance context | Nottingham Forest F.C. |
| Premier League Titles Won | 0 | Premier League title history | Nottingham Forest F.C. |
| FA Cup Titles | 2 | Club honours | Nottingham Forest F.C. |
| European Trophies Won | 3 | Club honours | Nottingham Forest F.C. |
17. Sunderland A.F.C.
Sunderland A.F.C. show the club profile, season record, stadium details, and player leaders in one structured view. Sunderland A.F.C.’s 1879 foundation, Sunderland city base, Stadium of Light, and 48,707 capacity define the club’s identity. The season data highlights 38 matches, 42 goals scored, 48 goals conceded, and a negative 6 goal difference. Player output, clean sheets, possession control, expected goals, discipline, and title history complete the performance context for Sunderland A.F.C.
The Sunderland A.F.C. statistics are listed below.
| Statistical Category | Profile Value / Attribute Data | Source Context | Team Name |
|---|---|---|---|
| Team Name | Sunderland A.F.C. | Club profile | Sunderland A.F.C. |
| Founded | 1879 | Club profile | Sunderland A.F.C. |
| City | Sunderland | Club profile | Sunderland A.F.C. |
| Stadium | Stadium of Light | Club profile | Sunderland A.F.C. |
| Stadium Capacity | 48,707 | Stadium profile | Sunderland A.F.C. |
| Matches Played | 38 | Season table context | Sunderland A.F.C. |
| Wins | 14 | Season table context | Sunderland A.F.C. |
| Draws | 12 | Season table context | Sunderland A.F.C. |
| Losses | 12 | Season table context | Sunderland A.F.C. |
| Goals Scored | 42 | Season table context | Sunderland A.F.C. |
| Goals Conceded | 48 | Season table context | Sunderland A.F.C. |
| Goal Difference | Negative 6 | Calculated from season data | Sunderland A.F.C. |
| Clean Sheets | 10 | Clean sheet context | Sunderland A.F.C. |
| Possession Percentage | 44.9% | Season data context | Sunderland A.F.C. |
| Shots per Match | 10.4 | Season data context | Sunderland A.F.C. |
| Pass Accuracy Percentage | 79.6% | Season data context | Sunderland A.F.C. |
| Yellow Cards | 82 | Season data context | Sunderland A.F.C. |
| Red Cards | 3 | Season data context | Sunderland A.F.C. |
| Home Record | 19 MP, 9 W, 6 D, 4 L | Season table context | Sunderland A.F.C. |
| Away Record | 19 MP, 5 W, 6 D, 8 L | Season table context | Sunderland A.F.C. |
| Points per Game | 1.42 | Calculated | Sunderland A.F.C. |
| Top Scorer | Enzo Le Fée, 6 goals | Player leader context | Sunderland A.F.C. |
| Most Assists | Enzo Le Fée, 6 assists | Player leader context | Sunderland A.F.C. |
| Market Value | [€214.60m] | Market value context | Sunderland A.F.C. |
| Average Attendance | 40,000+ matchday range | Attendance context | Sunderland A.F.C. |
| Premier League Titles Won | 0 | Premier League title history | Sunderland A.F.C. |
| FA Cup Titles | 2 | Club honours | Sunderland A.F.C. |
| European Trophies Won | 0 | Club honours | Sunderland A.F.C. |
18. Tottenham Hotspur F.C.
Tottenham Hotspur F.C. show the club profile, season record, stadium details, and player leaders in one structured view. Tottenham Hotspur F.C.’s 1882 foundation, London city base, Tottenham Hotspur Stadium, and 62,850 capacity define the club’s identity. The season data highlights 38 matches, 47 goals scored, 56 goals conceded, and a negative 9 goal difference. Player output, clean sheets, possession control, expected goals, discipline, and title history complete the performance context for Tottenham Hotspur F.C.
The Tottenham Hotspur F.C. statistics are listed below.
| Statistical Category | Profile Value / Attribute Data | Source Context | Team Name |
|---|---|---|---|
| Team Name | Tottenham Hotspur F.C. | Club profile | Tottenham Hotspur F.C. |
| Founded | 1882 | Club profile | Tottenham Hotspur F.C. |
| City | London | Club profile | Tottenham Hotspur F.C. |
| Stadium | Tottenham Hotspur Stadium | Club profile | Tottenham Hotspur F.C. |
| Stadium Capacity | 62,850 | Stadium profile | Tottenham Hotspur F.C. |
| Matches Played | 38 | Season table context | Tottenham Hotspur F.C. |
| Wins | 10 | Season table context | Tottenham Hotspur F.C. |
| Draws | 11 | Season table context | Tottenham Hotspur F.C. |
| Losses | 17 | Season table context | Tottenham Hotspur F.C. |
| Goals Scored | 47 | Season table context | Tottenham Hotspur F.C. |
| Goals Conceded | 56 | Season table context | Tottenham Hotspur F.C. |
| Goal Difference | Negative 9 | Calculated from season data | Tottenham Hotspur F.C. |
| Clean Sheets | 7 | Clean sheet context | Tottenham Hotspur F.C. |
| Possession Percentage | 53.1% | Season data context | Tottenham Hotspur F.C. |
| Shots per Match | 13.2 | Season data context | Tottenham Hotspur F.C. |
| Pass Accuracy Percentage | 84.0% | Season data context | Tottenham Hotspur F.C. |
| Yellow Cards | 78 | Season data context | Tottenham Hotspur F.C. |
| Red Cards | 3 | Season data context | Tottenham Hotspur F.C. |
| Home Record | 19 MP, 6 W, 6 D, 7 L | Season table context | Tottenham Hotspur F.C. |
| Away Record | 19 MP, 4 W, 5 D, 10 L | Season table context | Tottenham Hotspur F.C. |
| Points per Game | 1.08 | Calculated | Tottenham Hotspur F.C. |
| Top Scorer | Son Heung min, 11 goals | Player leader context | Tottenham Hotspur F.C. |
| Most Assists | James Maddison, 7 assists | Player leader context | Tottenham Hotspur F.C. |
| Market Value | [€689.30m] | Market value context | Tottenham Hotspur F.C. |
| Average Attendance | 61,000+ matchday range | Attendance context | Tottenham Hotspur F.C. |
| Premier League Titles Won | 0 | Premier League title history | Tottenham Hotspur F.C. |
| FA Cup Titles | 8 | Club honours | Tottenham Hotspur F.C. |
| European Trophies Won | 3 | Club honours | Tottenham Hotspur F.C. |
19. West Ham United F.C.
West Ham United F.C. show the club profile, season record, stadium details, and player leaders in one structured view. West Ham United F.C.’s 1895 foundation, London city base, London Stadium, and 62,500 capacity define the club’s identity. The season data highlights 38 matches, 37 goals scored, 56 goals conceded, and a negative 19 goal difference. Player output, clean sheets, possession control, expected goals, discipline, and title history complete the performance context for West Ham United F.C.
The West Ham United F.C. statistics are listed below.
| Statistical Category | Profile Value / Attribute Data | Source Context | Team Name |
|---|---|---|---|
| Team Name | West Ham United F.C. | Club profile | West Ham United F.C. |
| Founded | 1895 | Club profile | West Ham United F.C. |
| City | London | Club profile | West Ham United F.C. |
| Stadium | London Stadium | Club profile | West Ham United F.C. |
| Stadium Capacity | 62,500 | Stadium profile | West Ham United F.C. |
| Matches Played | 38 | Season table context | West Ham United F.C. |
| Wins | 10 | Season table context | West Ham United F.C. |
| Draws | 9 | Season table context | West Ham United F.C. |
| Losses | 19 | Season table context | West Ham United F.C. |
| Goals Scored | 37 | Season table context | West Ham United F.C. |
| Goals Conceded | 56 | Season table context | West Ham United F.C. |
| Goal Difference | Negative 19 | Calculated from season data | West Ham United F.C. |
| Clean Sheets | 6 | Clean sheet context | West Ham United F.C. |
| Possession Percentage | 44.1% | Season data context | West Ham United F.C. |
| Shots per Match | 10.2 | Season data context | West Ham United F.C. |
| Pass Accuracy Percentage | 77.6% | Season data context | West Ham United F.C. |
| Yellow Cards | 83 | Season data context | West Ham United F.C. |
| Red Cards | 4 | Season data context | West Ham United F.C. |
| Home Record | 19 MP, 6 W, 5 D, 8 L | Season table context | West Ham United F.C. |
| Away Record | 19 MP, 4 W, 4 D, 11 L | Season table context | West Ham United F.C. |
| Points per Game | 1.03 | Calculated | West Ham United F.C. |
| Top Scorer | Jarrod Bowen, 10 goals | Player leader context | West Ham United F.C. |
| Most Assists | Lucas Paquetá, 5 assists | Player leader context | West Ham United F.C. |
| Market Value | [€439.60m] | Market value context | West Ham United F.C. |
| Average Attendance | 62,000+ matchday range | Attendance context | West Ham United F.C. |
| Premier League Titles Won | 0 | Premier League title history | West Ham United F.C. |
| FA Cup Titles | 3 | Club honours | West Ham United F.C. |
| European Trophies Won | 3 | Club honours | West Ham United F.C. |
20. Wolverhampton Wanderers F.C.
Wolverhampton Wanderers F.C. show the club profile, season record, stadium details, and player leaders in one structured view. Wolverhampton Wanderers F.C.’s 1877 foundation, Wolverhampton city base, Molineux Stadium, and 32,050 capacity define the club’s identity. The season data highlights 38 matches, 31 goals scored, 72 goals conceded, and a negative 41 goal difference. Player output, clean sheets, possession control, expected goals, discipline, and title history complete the performance context for Wolverhampton Wanderers F.C.
The Wolverhampton Wanderers F.C. statistics are listed below.
| Statistical Category | Profile Value / Attribute Data | Source Context | Team Name |
|---|---|---|---|
| Team Name | Wolverhampton Wanderers F.C. | Club profile | Wolverhampton Wanderers F.C. |
| Founded | 1877 | Club profile | Wolverhampton Wanderers F.C. |
| City | Wolverhampton | Club profile | Wolverhampton Wanderers F.C. |
| Stadium | Molineux Stadium | Club profile | Wolverhampton Wanderers F.C. |
| Stadium Capacity | 32,050 | Stadium profile | Wolverhampton Wanderers F.C. |
| Matches Played | 38 | Season table context | Wolverhampton Wanderers F.C. |
| Wins | 3 | Season table context | Wolverhampton Wanderers F.C. |
| Draws | 11 | Season table context | Wolverhampton Wanderers F.C. |
| Losses | 24 | Season table context | Wolverhampton Wanderers F.C. |
| Goals Scored | 31 | Season table context | Wolverhampton Wanderers F.C. |
| Goals Conceded | 72 | Season table context | Wolverhampton Wanderers F.C. |
| Goal Difference | Negative 41 | Calculated from season data | Wolverhampton Wanderers F.C. |
| Clean Sheets | 4 | Clean sheet context | Wolverhampton Wanderers F.C. |
| Possession Percentage | 42.8% | Season data context | Wolverhampton Wanderers F.C. |
| Shots per Match | 9.6 | Season data context | Wolverhampton Wanderers F.C. |
| Pass Accuracy Percentage | 76.9% | Season data context | Wolverhampton Wanderers F.C. |
| Yellow Cards | 85 | Season data context | Wolverhampton Wanderers F.C. |
| Red Cards | 5 | Season data context | Wolverhampton Wanderers F.C. |
| Home Record | 19 MP, 2 W, 6 D, 11 L | Season table context | Wolverhampton Wanderers F.C. |
| Away Record | 19 MP, 1 W, 5 D, 13 L | Season table context | Wolverhampton Wanderers F.C. |
| Points per Game | 0.53 | Calculated | Wolverhampton Wanderers F.C. |
| Top Scorer | Matheus Cunha, 9 goals | Player leader context | Wolverhampton Wanderers F.C. |
| Most Assists | João Gomes, 5 assists | Player leader context | Wolverhampton Wanderers F.C. |
| Market Value | [€351.40m] | Market value context | Wolverhampton Wanderers F.C. |
| Average Attendance | 31,000+ matchday range | Attendance context | Wolverhampton Wanderers F.C. |
| Premier League Titles Won | 0 | Premier League title history | Wolverhampton Wanderers F.C. |
| FA Cup Titles | 4 | Club honours | Wolverhampton Wanderers F.C. |
| European Trophies Won | 0 | Club honours | Wolverhampton Wanderers F.C. |