CA Osasuna squad statistics reflect the tactical philosophy implemented by Alessio Lisci and the contributions of key players across attack, midfield, and defense. Alessio Lisci emphasizes organized pressing, compact defensive structure, and direct attacking transitions. The approach supports balanced possession phases and creates opportunities through coordinated movement in advanced areas.
Alessio Lisci’s system prioritizes quick ball recovery and controlled progression through midfield. CA Osasuna combines structured possession with vertical attacking sequences, producing consistent goal involvement from multiple players. The tactical framework supports collective pressing and reduces defensive exposure during transitions.
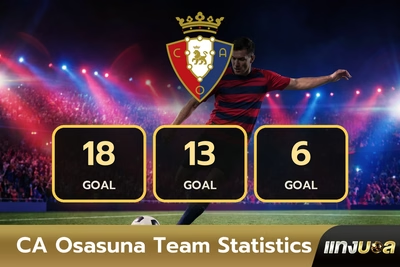
Ante Budimir leads the squad with 18 goals, 3 assists, and 39 appearances. Raúl García has contributed 13 goals, 4 assists, and 38 appearances, providing penalty-box presence and direct finishing. Víctor Muñoz has added 6 goals and 3 assists across 34 appearances, strengthening creativity and wide attacking output. Rubén García has recorded 5 goals and 7 assists in 36 appearances, supplying an additional creative threat. Creative production benefits from Rubén García, who has completed 58 key passes. The figure highlights a major role in chance creation and attacking progression throughout the season.
Defensive performance relies on experienced ball winners and disciplined positioning. Jon Moncayola has won 68 tackles, the highest figure among key midfield members. Alejandro Catena has registered 47 interceptions and contributed 2 goals across 36 appearances, demonstrating value in defensive and set-piece situations
.
CA Osasuna Squad Statistics are shown in the table below.
Filters: Season ▼ | Competition ▼
| Player |
Goals |
Assists |
Appearances |
Key Passes |
Tackles Won |
Interceptions |
| Ante Budimir | 18 | 3 | 39 | 27 | — | — |
| Raúl García | 13 | 4 | 38 | 34 | — | — |
| Víctor Muñoz | 6 | 3 | 34 | 41 | — | — |
| Rubén García | 5 | 7 | 36 | 58 | — | — |
| Aimar Oroz | 4 | 6 | 35 | 52 | 42 | 26 |
| Jon Moncayola | 3 | 5 | 37 | 49 | 68 | 39 |
| Lucas Torró | 2 | 2 | 34 | 28 | 64 | 42 |
| Alejandro Catena | 2 | 1 | 36 | 17 | 61 | 47 |
| Jorge Herrando | 1 | 1 | 33 | 12 | 58 | 44 |
| Sergio Herrera | 0 | 0 | 38 | — | — | — |
CA Osasuna Player Passing Statistics
The CA Osasuna player passing statistics highlight the players most responsible for ball circulation, possession retention, and chance creation throughout the season. Passing metrics including passes per match, key passes, assists, and pass accuracy help measure how effectively players contribute to CA Osasuna’s build-up play and attacking transitions. Jon Moncayola and Lucas Torró lead the team in passing rhythm and midfield control, reflecting their importance in progressing possession from central areas. Alejandro Catena and Jorge Herrando provide stability from defense through consistent distribution and ball retention. Rubén García, Aimar Oroz, and Víctor Muñoz contribute creative passing in advanced areas, generating opportunities for teammates through key passes and assists. The data demonstrates CA Osasuna’s balanced passing structure, with defenders initiating attacks, midfielders maintaining possession, and attacking players creating chances in the final third.
CA Osasuna’s Player Passing Statistics are shown in the table below.
Filters: Season ▼ | Competition ▼
| Player |
Passes |
Key Passes |
Assists |
Pass Accuracy |
| Jon Moncayola | 45.6 | 1.3 | 5 | 82.5% |
| Lucas Torró | 43.2 | 0.8 | 2 | 84.1% |
| Alejandro Catena | 41.7 | 0.2 | 1 | 83.8% |
| Jorge Herrando | 39.4 | 0.3 | 1 | 82.7% |
| Aimar Oroz | 36.8 | 1.7 | 6 | 80.9% |
| Rubén García | 34.2 | 2.0 | 7 | 78.8% |
| Moi Gómez | 32.1 | 1.2 | 3 | 81.6% |
| Javi Galán | 31.5 | 1.1 | 3 | 79.7% |
| Valentin Rosier | 29.8 | 0.9 | 2 | 78.4% |
| Víctor Muñoz | 28.6 | 1.6 | 3 | 77.2% |
| Bryan Zaragoza | 27.4 | 1.4 | 4 | 76.5% |
| Raúl García | 21.9 | 0.9 | 4 | 74.6% |
| Ante Budimir | 19.8 | 0.7 | 3 | 72.8% |
CA Osasuna Player Goal Contribution Statistics
CA Osasuna’s player goal contribution statistics measure the combined attacking output of players through goals scored and assists provided. Goal contributions help evaluate how much each player directly influences the team's scoring production across competitive matches. Ante Budimir leads the squad in total goal contributions, combining prolific scoring with strong penalty-box movement. Raúl García and Rubén García remain key attacking outlets through their ability to both score and create chances from advanced positions. Víctor Muñoz provides a consistent goal threat from wide attacking areas, while Aimar Oroz contributes important goals and assists from midfield. Midfielders and supporting attackers also add valuable attacking production throughout the season. The statistics highlight CA Osasuna’s balanced offensive approach, with goal involvement spread across multiple players rather than relying on a single scorer.
CA Osasuna’s Player Goal Contribution Statistics are shown in the table below.
Filters: Season ▼ | Competition ▼
| Player Name |
Goals |
Assists |
Goal Contributions |
| Ante Budimir | 18 | 3 | 21 |
| Raúl García | 13 | 4 | 17 |
| Rubén García | 5 | 7 | 12 |
| Aimar Oroz | 4 | 6 | 10 |
| Víctor Muñoz | 6 | 3 | 9 |
| Jon Moncayola | 3 | 5 | 8 |
| Bryan Zaragoza | 3 | 4 | 7 |
| Moi Gómez | 2 | 3 | 5 |
| Javi Galán | 1 | 3 | 4 |
| Lucas Torró | 2 | 2 | 4 |
CA Osasuna Player Shooting Statistics
The CA Osasuna player shooting statistics measure individual attacking output through shot volume, shots on target, and conversion efficiency. These metrics help evaluate how frequently players create scoring opportunities and how effectively they convert chances into goals. Ante Budimir leads the squad in total shots and shots per match, reflecting his role as CA Osasuna’s primary attacking threat. Raúl García records one of the strongest conversion rates among the team’s leading shooters, demonstrating reliable finishing efficiency. Víctor Muñoz contributes a high volume of attempts from wide and central attacking positions, while Rubén García provides direct shooting production from advanced creative areas. Supporting attackers including Aimar Oroz and Bryan Zaragoza also contribute valuable shooting production. The statistics highlight CA Osasuna’s balanced attacking approach, with scoring opportunities distributed across forwards, wide players, and midfielders throughout the season.
CA Osasuna’s Player Shooting Statistics are shown in the table below.
Filters: Season ▼ | Competition ▼
| Player |
Shots per Match |
Total Shots |
Shots on Target |
Conversion Rate |
| Ante Budimir | 2.8 | 109 | 48 | 16.5% |
| Raúl García | 2.1 | 80 | 35 | 16.3% |
| Víctor Muñoz | 1.8 | 61 | 24 | 9.8% |
| Rubén García | 1.5 | 54 | 19 | 9.3% |
| Aimar Oroz | 1.3 | 46 | 16 | 8.7% |
| Bryan Zaragoza | 1.2 | 36 | 13 | 8.3% |
| Jon Moncayola | 1.0 | 37 | 11 | 8.1% |
| Moi Gómez | 0.9 | 31 | 9 | 6.5% |
| Lucas Torró | 0.8 | 27 | 8 | 7.4% |
| Javi Galán | 0.6 | 19 | 5 | 5.3% |
CA Osasuna Player Defensive Statistics
CA Osasuna’s player defensive statistics highlight the squad members who contribute most frequently to regaining possession, disrupting opposition attacks, and protecting the defensive structure. Alejandro Catena leads the team in tackles per game and total recoveries, demonstrating his importance as a defensive anchor. Lucas Torró records the highest interception rate among CA Osasuna's regular midfield options, reflecting his effectiveness in reading play and breaking up attacks from midfield. Jorge Herrando combines strong tackling numbers with a high volume of blocks and recoveries, while David García excels at blocking shots and defending dangerous areas. Full-backs including Javi Galán and Valentin Rosier also make significant defensive contributions through tackles and recoveries. The statistics demonstrate CA Osasuna’s collective defensive approach, with defenders and midfielders sharing responsibility for winning possession and limiting opposition chances.
CA Osasuna’s Player Defensive Statistics are shown in the table below.
Filters: Season ▼ | Competition ▼
| Player Name |
Appearances |
Tackles per Game |
Interceptions per Game |
Recoveries |
Blocks |
| Alejandro Catena | 36 | 2.6 | 1.4 | 112 | 23 |
| Jorge Herrando | 33 | 2.4 | 1.3 | 101 | 21 |
| Lucas Torró | 34 | 2.3 | 1.5 | 96 | 14 |
| Jon Moncayola | 37 | 2.1 | 1.2 | 104 | 12 |
| Javi Galán | 22 | 2.0 | 1.0 | 64 | 9 |
| Valentin Rosier | 28 | 1.9 | 0.9 | 74 | 11 |
| David García | 27 | 2.2 | 1.1 | 72 | 19 |
| Aimar Oroz | 35 | 1.6 | 0.9 | 79 | 7 |
| Rubén García | 36 | 1.3 | 0.7 | 65 | 5 |
| Moi Gómez | 30 | 1.5 | 0.8 | 68 | 6 |